 EMODnet Product Catalogue
0.05 degree
Type of resources
Available actions
Topics
Keywords
Contact for the resource
Provided by
Years
Formats
Representation types
status
Resolution
-
Moving 6-year analysis of Water body silicate in Black Sea for each season: winter (December-February), spring (March-May), summer (June-August), autumn (September-November). Every year of the time dimension corresponds to the 6-year centered average of the season. 6-years periods span from 1980-1985 until 2016-2021. Data Sources: observational data from SeaDataNet/EMODNet Chemistry Data Network. Units: umol/l. DIVA analysis: The computation was done with the DIVAnd (Data-Interpolating Variational Analysis in n dimensions), version 2.7.9, using GEBCO 30sec topography for the spatial connectivity of water masses. The horizontal resolution of the produced DIVAnd maps grids is 0.05 degrees. The vertical resolution is 15 depth levels: 0, 5, 10, 20, 30, 40, 50, 60, 70, 80, 90, 100, 125, 150, 200m The horizontal correlation length: 75km. The vertical correlation length (in meters): twice the vertical resolution (10, 10, 20, 20, 20, 20, 20, 20, 20, 20, 20, 50, 50, 100, 100). The error variance (epsilon2): 1 An anamorphosis transformation was applied to the data: threshold value=200. Background field: not used. Quality control of the observations was applied using the interpolated field: QCMETHOD=3 and visual inspection (Observations with residuals outside the minimum and maximum values of the 99% quantile were discarded from the analysis after thoroughly visual inspection)
-
Moving 6-year analysis of Water body phosphate in Black Sea for each season: winter (December-February), spring (March-May), summer (June-August), autumn (September-November). Every year of the time dimension corresponds to the 6-year centered average of the season. 6-years periods span from 1980-1985 until 2016-2021. Data Sources: observational data from SeaDataNet/EMODNet Chemistry Data Network. Units: umol/l. DIVA analysis: The computation was done with the DIVAnd (Data-Interpolating Variational Analysis in n dimensions), version 2.7.9, using GEBCO 30sec topography for the spatial connectivity of water masses. The horizontal resolution of the produced DIVAnd maps grids is 0.05 degrees. The vertical resolution is 15 depth levels: 0, 5, 10, 20, 30, 40, 50, 60, 70, 80, 90, 100, 125, 150, 200m The horizontal correlation length: 80km. The vertical correlation length (in meters): twice the vertical resolution (10, 10, 20, 20, 20, 20, 20, 20, 20, 20, 20, 50, 50, 100, 100). The error variance (epsilon2): 1 An anamorphosis transformation was applied to the data: threshold value=200. Background field: not used. Quality control of the observations was applied using the interpolated field: QCMETHOD=3 and visual inspection (Observations with residuals outside the minimum and maximum values of the 99% quantile were discarded from the analysis after thoroughly visual inspection)
-
Moving 6-year analysis of Water body chlorophyll-a in Black Sea for each season: winter (December-February), spring (March-May), summer (June-August), autumn (September-November). Every year of the time dimension corresponds to the 6-year centered average of the season. 6-years periods span from 1990-1995 until 2016-2021. Data Sources: observational data from SeaDataNet/EMODNet Chemistry Data Network. Units: mg/m^3. DIVA analysis: The computation was done with the DIVAnd (Data-Interpolating Variational Analysis in n dimensions), version 2.7.9, using GEBCO 30sec topography for the spatial connectivity of water masses. The horizontal resolution of the produced DIVAnd maps grids is 0.05 degrees. The vertical resolution is 7 depth levels: 0, 5, 10, 20, 30, 40, 50m. The horizontal correlation length: 80km. The vertical correlation length (in meters): twice the vertical resolution (10, 10, 20, 20, 20, 20, 20). The error variance (epsilon2): 1 An anamorphosis transformation was applied to the data: threshold value=200. Background field: not used. Quality control of the observations was applied using the interpolated field: QCMETHOD=3 and visual inspection (Observations with residuals outside the minimum and maximum values of the 99% quantile were discarded from the analysis after thoroughly visual inspection).
-
Moving 6-year analysis of Water body dissolved inorganic nitrogen in Black Sea for each season: winter (December-February), spring (March-May), summer (June-August), autumn (September-November). Every year of the time dimension corresponds to the 6-year centered average of the season. 6-years periods span from 1990-1995 until 2016-2021. Data Sources: observational data from SeaDataNet/EMODNet Chemistry Data Network. Units: umol/l. DIVA analysis: The computation was done with the DIVAnd (Data-Interpolating Variational Analysis in n dimensions), version 2.7.9, using GEBCO 30sec topography for the spatial connectivity of water masses. The horizontal resolution of the produced DIVAnd maps grids is 0.05 degrees. The vertical resolution is 12 depth levels: 0, 5, 10, 20, 30, 40, 50, 60, 70, 80, 90, 100m. The horizontal correlation length: 80km. The vertical correlation length (in meters): twice the vertical resolution (10, 10, 20, 20, 20, 20, 20, 20, 20, 20, 20, 20). The error variance (epsilon2): 1 An anamorphosis transformation was applied to the data: threshold value=200. Background field: not used. Quality control of the observations was applied using the interpolated field: QCMETHOD=3 and visual inspection (Observations with residuals outside the minimum and maximum values of the 99% quantile were discarded from the analysis after thoroughly visual inspection).
-
Moving 6-year analysis of Water body dissolved oxygen concentration in Black Sea for each season: winter (December-February), spring (March-May), summer (June-August), autumn (September-November). Every year of the time dimension corresponds to the 6-year centered average of the season. 6-years periods span from 1980-1985 until 2016-2021. Data Sources: observational data from SeaDataNet/EMODNet Chemistry Data Network. Units: umol/l. DIVA analysis: The computation was done with the DIVAnd (Data-Interpolating Variational Analysis in n dimensions), version 2.7.9, using GEBCO 30sec topography for the spatial connectivity of water masses The horizontal resolution of the produced DIVAnd maps grids is 0.05 degrees. The vertical resolution is 16 depth levels: 0, 5, 10, 20, 30, 40, 50, 60, 70, 80, 90, 100, 125, 150, 200, 250m The horizontal correlation length: 100km. The vertical correlation length (in meters): twice the vertical resolution (10, 10, 20, 20, 20, 20, 20, 20, 20, 20, 20, 50, 50, 100, 100, 100). The error variance (epsilon2): 1 An anamorphosis transformation was applied to the data: threshold value=200. Background field: not used. Quality control of the observations was applied using the interpolated field: QCMETHOD=3 and visual inspection (Observations with residuals outside the minimum and maximum values of the 99% quantile were discarded from the analysis after thoroughly visual inspection)
-
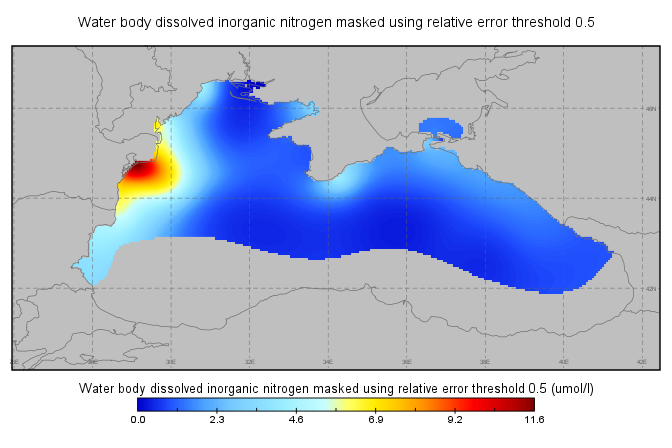
Moving 6-year analysis of Water_body_dissolved_inorganic_nitrogen_(DIN) in the Black Sea.for each season: spring (March-May), summer (June-August), autumn (September-November), winter (December-February). Every year of the time dimension corresponds to the 6-years centred average of each season. 6-years periods span: - from 1990-1995 until 2013-2018 (spring), - from 1990-1995 until 2013-2018 (summer), - from 1990-1995 until 2013-2018 (autumn), - from 1990-1995 until 2011-2016 (winter). Depth range (IODE standard depths): -100.0, -75.0, -50.0,-40.0, -30.0, -20.0, -10.0, -5.0, -0.0. Data Sources: observational data from SeaDataNet/EMODnet Chemistry Data Network. Description of DIVA analysis: Geostatistical data analysis by DIVA (Data-Interpolating Variational Analysis) tool. GEBCO 1min topography is used for the contouring preparation. Analysed field masked using relative error threshold 0.3 and 0.5 DIVA settings: signal-to-noise ratio and correlation length were estimated using data mean distance as a minimum (for L) and vertically filtered. Background field: the data mean value is subtracted from the data. Detrending of data: no, Advection constraint applied: no. Units: umol/l.
-
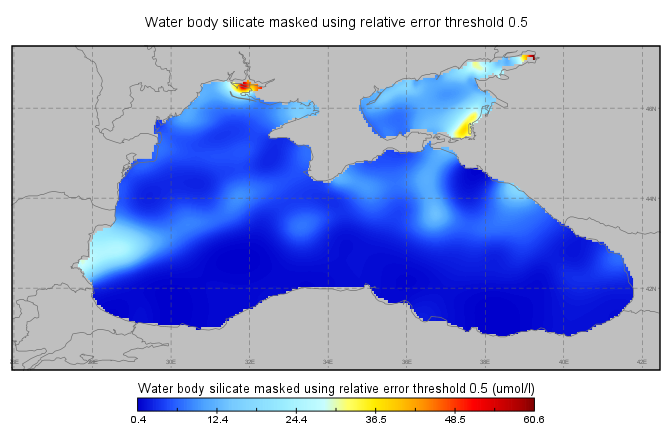
Moving 6-year analysis of Water_body_silicate in the Black Sea for each season: spring (March-May), summer (June-August), autumn (September-November), winter (December-February). Every year of the time dimension corresponds to the 6-years centred average of each season. 6-years periods span: from 1970-1975 until 2013-2018 Depth range (IODE standard depths): -200.0, -150.0, -125.0, -100.0, -75.0, -50.0,-40.0, -30.0, -20.0, -10.0, -5.0, -0.0. Data Sources: observational data from SeaDataNet/EMODnet Chemistry Data Network. Description of DIVA analysis: Geostatistical data analysis by DIVA (Data-Interpolating Variational Analysis) tool. GEBCO 1min topography is used for the contouring preparation. Analysed field masked using relative error threshold 0.3 and 0.5 DIVA settings: signal-to-noise ratio and correlation length were estimated using data mean distance as a minimum (for L) and vertically filtered. Log transformation was used in the analyses. Background field: the data mean value is subtracted from the data. Detrending of data: no, Advection constraint applied: no. Units: umol/l. The entire set of related maps can be found in the viewing service: http://ec.oceanbrowser.net/emodnet/
-
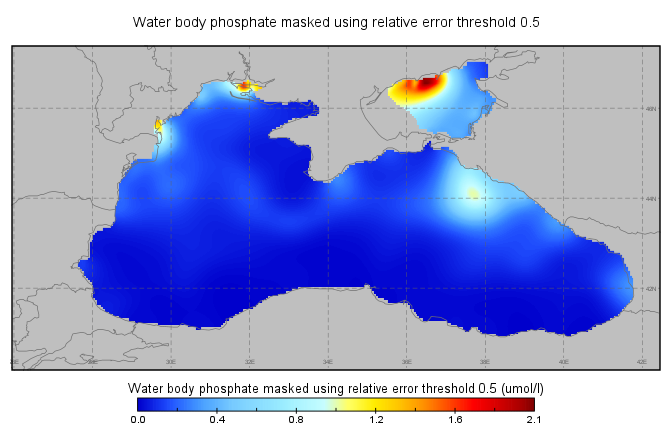
Moving 6-year analysis of Water_body_phosphate in the Black Sea for each season: spring (March-May), summer (June-August), autumn (September-November), winter (December-February). Every year of the time dimension corresponds to the 6-years centred average of each season. 6-years periods span: from 1970-1975 until 2013-2018 Depth range (IODE standard depths): -200.0, -150.0, -125.0, -100.0, -75.0, -50.0,-40.0, -30.0, -20.0, -10.0, -5.0, -0.0. Data Sources: observational data from SeaDataNet/EMODnet Chemistry Data Network. Description of DIVA analysis: Geostatistical data analysis by DIVA (Data-Interpolating Variational Analysis) tool. GEBCO 1min topography is used for the contouring preparation. Analysed field masked using relative error threshold 0.3 and 0.5 DIVA settings: signal-to-noise ratio and correlation length were estimated using data mean distance as a minimum (for L) and vertically filtered. Log transformation was used in the analyses. Background field: the data mean value is subtracted from the data. Detrending of data: no, Advection constraint applied: no. Units: umol/l.
-
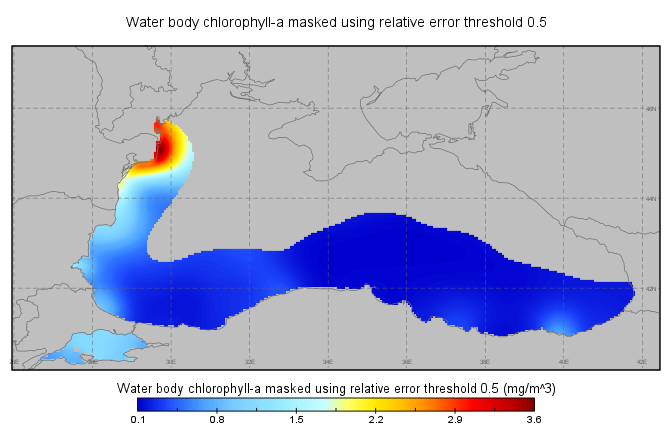
Moving 6-year analysis of Water_body_chlorophyll-a in the Black Sea for each season: spring (March-May), summer (June-August), autumn (September-November), winter (December-February). Every year of the time dimension corresponds to the 6-years centred average of each season. 6-years periods span: - from 1990-1995 until 2012-2017 (spring), - from 1990-1995 until 2013-2018 (summer), - from 1990-1995 until 2013-2018 (autumn), - from 1990-1995 until 2011-2016 (winter). Depth range (IODE standard depths): -50.0, -40.0, -30.0, -20.0, -10.0, -5.0, -0.0. Description of DIVA analysis: Geostatistical data analysis by DIVA (Data-Interpolating Variational Analysis) tool. GEBCO 1min topography is used for the contouring preparation. Analysed field masked using relative error threshold 0.3 and 0.5 DIVA settings: signal-to-noise ratio and correlation length were estimated using data mean distance as a minimum (for L) and vertically filtered. Log transformation was used in the analyses. Background field: the data mean value is subtracted from the data. Detrending of data: no, Advection constraint applied: no. Units: umol/l.
-
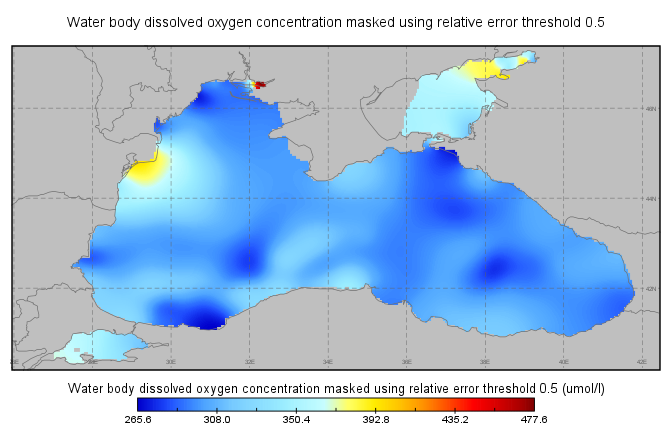
Moving 6-year analysis of Water_body_dissolved_oxygen_concentration in the Black Sea for each season: spring (March-May), summer (June-August), autumn (September-November), winter (December-February). Every year of the time dimension corresponds to the 6-years centred average of each season. 6-years periods span: from 1970-1975 until 2015-2020 Depth range (IODE standard depths): -250.0, -200.0, -150.0, -125.0, -100.0, -75.0, -50.0,-40.0, -30.0, -20.0, -10.0, -5.0, -0.0. Data Sources: observational data from SeaDataNet/EMODnet Chemistry Data Network. Description of DIVA analysis: Geostatistical data analysis by DIVA (Data-Interpolating Variational Analysis) tool. GEBCO 1min topography is used for the contouring preparation. Analysed field masked using relative error threshold 0.3 and 0.5 DIVA settings: signal-to-noise ratio and correlation length were estimated using data mean distance as a minimum (for L) and vertically filtered. Log transformation was used in the analyses. Background field: the data mean value is subtracted from the data. Detrending of data: no, Advection constraint applied: no. Units: umol/l. The entire set of related maps can be found in the viewing service: https://emodnet.ec.europa.eu/geoviewer/